

Short answer. Agent failures hide between the steps, and request-response logging records only the input and the final answer, so the step that went wrong is invisible. Trace every step, the model calls, tool inputs and outputs, decisions, retries, tokens, and cost, and the silent failures become debuggable. The OpenTelemetry GenAI conventions now define exactly what to capture, so you can instrument once and keep it portable.
Most of the agent's chain runs in the dark. The one place the truth diverged from the output is only visible where it was traced. Hero image.
Key facts.
- An agent produces far more telemetry than a web request, and its multi-step reasoning does not fit a fixed log schema, which is why request-response logging cannot capture what an agent actually did (OpenTelemetry GenAI semantic conventions, 2025).
- There is now a standard: OpenTelemetry's GenAI semantic conventions (v1.37) define how to trace agent invocation, tool calls, token usage, cost, and model decisions, with attributes like
gen_ai.operation.nameandgen_ai.usage.input_tokens(OpenTelemetry, 2025-2026). - The silent failures only appear in the trace: a tool that returned an error treated as success, or a reasoning-action mismatch, leaves the final answer looking fine and is visible only when you can inspect each step (cross-ref MAST, arXiv:2503.13657).
Why doesn't normal logging work for agents?
Because an agent is not a request, it is a sequence of decisions. A web request produces a line or two of logs: in, out, status. A single agent run produces a model call with a large prompt and completion, several tool calls each with structured inputs and outputs, retries, a token and cost tally, and a chain of reasoning that decided what to do next. Standard logging was built to record the in and out of a stateless request, and an agent's multi-step, non-deterministic reasoning does not fit that fixed schema. So your logs show that the agent ran and what it finally said, and almost nothing about how it got there, which is exactly the part that broke.
What a trace shows that a log doesn't
A trace records every step as a connected span: each model call, each tool call with its real input and output, each decision, the tokens and cost, and how they nest. That is where the silent failures live. The support agent that reported a refund as done when the tool returned an error inside a 200 response, the agent whose stated reasoning pointed one way while its action went another, the run that quietly retried a failing call many times, none of these change the final answer's appearance. They are invisible in a log and obvious in a trace, because the trace lets you see the exact step where the truth and the output diverged.
# A trace span makes the silent failure obvious:
span: invoke_tool process_refund
  http.status: 200
  output: { "success": false, "error": "card_declined" }
  agent.next_step: "Tell the customer the refund is complete"
# The final answer looks fine. Only the trace shows it acted on a failed call.
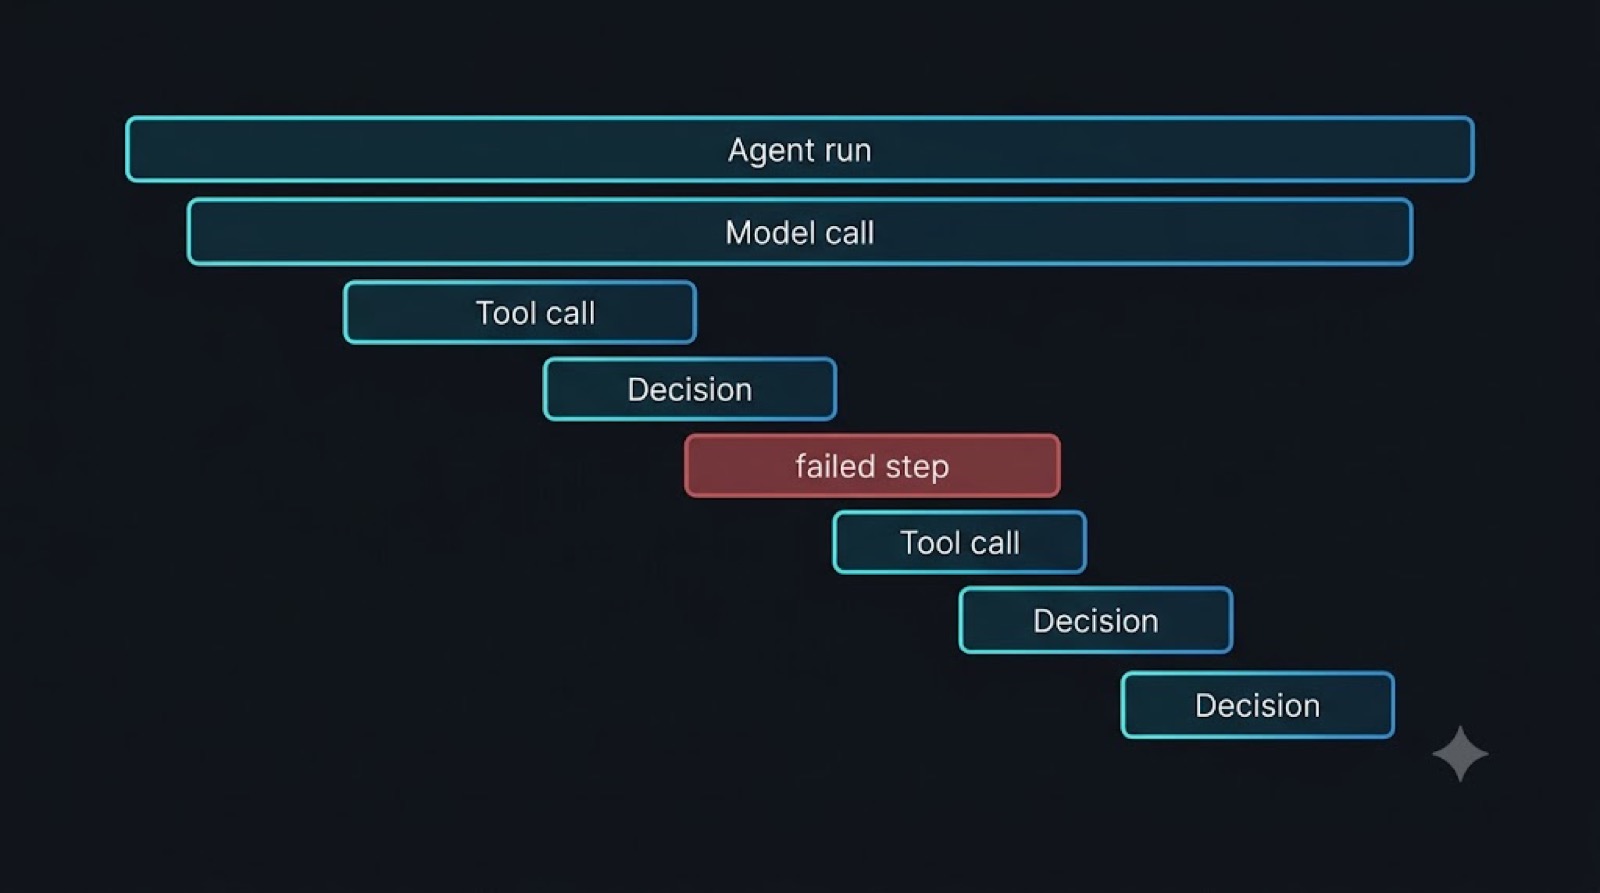
A trace waterfall: the agent run as nested time-bars, model call, tool call, decision, with the one failed step marked in red where a log would show nothing. Diagram.
There's now a standard for it
You no longer have to invent the schema. OpenTelemetry's GenAI semantic conventions, at version 1.37, standardize how to trace LLM and agent applications: spans for agent creation and invocation, tool calling, and the model call, with defined attributes for the model and provider, token usage, cost, latency, and finish reason. The conventions exist because, as the spec notes, an LLM call produces far more telemetry than an HTTP request and an agent's reasoning cannot be captured in a fixed schema, so the standard defines what to record. Major observability tools have adopted it, which means you can instrument once and keep your traces portable across vendors instead of locking into one.
What to instrument
| Capture | Why it matters |
|---|---|
| Every step as a span | See the chain, not just the final answer |
| Tool inputs and outputs | Catch error-as-success and mis-read fields |
| The model's decision | Spot reasoning-action mismatch and drift |
| Tokens and cost per step | Find the cost blowups and retry spirals |
| Retries and errors | See loops and swallowed failures |
| A quality / eval signal | Tie each trace to whether the outcome was actually right |
The pattern is that an agent's failures hide between its steps, and a log that records only the input and the final output cannot show you the step where it went wrong. Trace every step, capture tool inputs and outputs and the model's decisions, adopt the OpenTelemetry GenAI conventions so it stays portable, and tie traces to whether the outcome was actually correct. None of that is a bigger model, which fails just as silently without instrumentation. It is the visibility layer that turns an invisible agent failure into a debuggable one, which is what VibeModel builds as the Pattern Intelligence Layer.
Frequently asked questions
Isn't my existing logging enough?
Not for agents. Standard logs capture the input and final output of a stateless request. An agent's failure is usually a wrong step in the middle, a swallowed tool error, a bad decision, which never shows up in input-output logging.
What's the most important thing to trace?
Tool inputs and outputs at each step. That is where error-as-success, mis-read fields, and silent failures appear. Pair it with the model's decision so you can see when reasoning and action diverged.
Do I have to build the tracing schema myself?
No. The OpenTelemetry GenAI semantic conventions define spans and attributes for agents, tools, and model calls, and major tools support them. Instrument to the standard once and your traces stay portable.